« Dimensional Tables and Fact Tables | Datamartist Beta Presented in Toronto »
Datamartist at the Financial Technology Show in Toronto
As we get closer and closer to the Beta, a major milestone is coming up fast. nModal Solutions will be proudly presenting the pre-Beta at the Financial Technology Show on Nov. 25
As anyone who has exhibited at a trade show can tell you there is a fair  amount of work to be done to make it all happen. I’m very pleased with how its all coming together. If you are in Toronto on Nov. 25, drop by booth #104 and take Datamartist for a spin.
We’re looking forward to unveiling the next wave in memory based data transformation in person at the trade show. But most of the action is online (of course)- and the next phase of Datamartist’s development is one of the most exciting. Our beta testers, although of course helping us squish the bugs that got through Alpha, are also going to give us all sorts of juicy functionality to really flesh out the application.
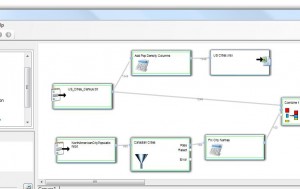
Datamartist is based on a block and canvas approach, that lets users break down complex data transformations into a series of steps, each one represented by a “Block” on the data canvas. Because the user can see the data set at every step of the process, it turns complex transformations into a series of simple ones. I particularly like this approach because I’m a visual thinker-I like drawings and diagrams. (It’s my engineering soul coming to the fore.)
But unlike the extremely expensive and technically focused solutions currently available, Datamartist does not require complex programming skills, and maintains a much more flexible outlook on data typing and table structure- it’s closer to a spreadsheet than a database in some ways.
Because of its ease of use, you don’t need to hire expensive IT resources to build what you want. The whole premise of Datamartist is bringing new capability to the end users.
Rather than literally pages of impossible to read Structured Query Language (SQL), the canvas is an easy to navigate map, with each block along the way understandable, configurable, and clear.
On the other hand, unlike a spreadsheet, Datamartist maintains formal data models and rules, as well as the underlying Meta Data needed to design dimensional hierarchies, and create conformed dimensions within multiple data marts.
Sign up for the Beta. Take control of your data.
« Dimensional Tables and Fact Tables | Datamartist Beta Presented in Toronto »


