« Small data in the age of Big Data | Set up a test then check the data then decide »
Putting data analysis into the hands of the business user
Having too many people involved can slow down the entire analytics process- by using tools that are designed to be accessible by business users, huge gains can be made.
However a challenge faced by all companies is connecting the business knowledge and data manipulation knowledge in a way that the data can be used.
As recently discussed in a recent McKinsey blog post 98% of CMOs characterize finding data scientist type resources a challenge.
Typically, what happens is that more than one person is required- often even three- The business person needing the answer, a Business Analyst who can formulate the question and apply a combination of business and data expertise, and then an IT wizard who can actually write the SQL or program to get the data, set up the servers and databases etc. etc.
Using a visual model to eliminate programming and SQL
Datamartist aims to simplify the process for at least some of the analysis that gets done- eliminating at least one, and perhaps sometimes even two of these players in some cases. (Hint- its the business person that always remains- their is no point in finding answers unless they are driving the business forward).
This is by creating a visual interface where data sets can be connected together, adjusted and combined visually. Blocks represent data sets, or transformations on the data, and the flow of data as it evolves can be tracked across the canvas.
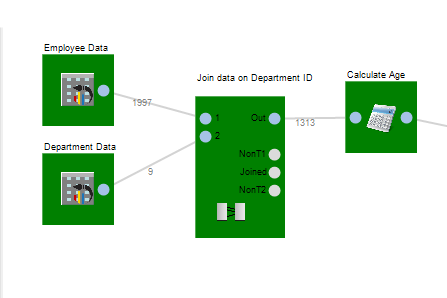
In the above example, we can see two input data sets joined together and a calculation done on the result. Every circle on each block is called a “stub” and by clicking on the stub we can see the data at that step. The result is that a sophisticated data query can be built a step at a time, without ever having to use code.
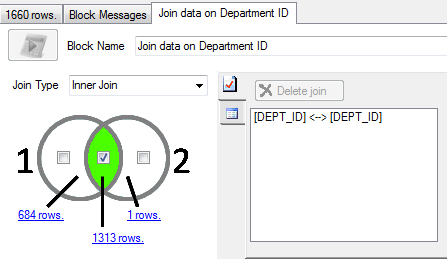
For example, the join block above gives a simple user interface- just pick the columns that you want to match up, and it visually shows how many rows connected.

« Small data in the age of Big Data | Set up a test then check the data then decide »