« Data modelling Hierarchies- how to make a dimension | Datamartist at the Financial Technology Show in Toronto »
Dimensional Tables and Fact Tables
One of the secrets to putting together a good set of data marts is the concept of dimensions. There are two key steps being able to analyse your data, and to build a working data mart model.
- Build a set of clean, consistent dimension tables that store reference information about your key dimensions like Product, Customer, Geographical Areas, Sales Areas etc.
- Join them up to a fact table that does NOT have dimensional data in it. Just the facts, ma’am.
Usually, to make a proper star schema data mart, it is necessary to transform the source data set, removing dimensional data, and generating a fact set. The dimensional data that is removed must be transformed to remove duplicate rows and to resolve any data quality issues that might exist. Transactional systems don’t know about dimensions- but you do.
A key part of the data modelling is to determine which fields in the source data should be put in the Dimensional tables and which fields should go to the Fact table.
Determining the Grain of the fact table
The very first step is to determine WHAT exactly is one fact in our fact table going to be? The GRAIN or GRANULARITY of the fact table refers to the level of detail of each row in the fact table. For example, an order fact table might have a grain of order, with one row per order, or order line, with a row for every line on each order (meaning more than one line for some orders). It is key to make a decision on the grain of the fact table first. This is often a balance between keeping detail, and managing complexity.
This a key question, and is driven by what it is you want to analyse. For example, if the decision is made to have a granularity of one row per order, then it might be necessary to remove all product information (since any given order might have multiple products) and only have total order value. This won’t work if you want to analyse product segments, or compare different products.
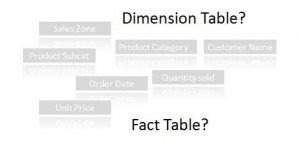
To have our cake and eat it too, we’ll use a simplified example of order data where the grain is one row equals one order and every order in our system has one and only one product. This table has the following columns:
Order Number, Order Date, Ship Date, Customer Name, Customer Segment, Product Name, Product Category, Product Sub Category, Quantity Sold, Unit Price
Some Simple Questions to guide us
To determine which columns should be in the dimension table and which columns in the fact table, ask yourself these questions:
Is the data in the column something that is unique for every order? – if Yes, then its definitely part of the fact table- So order number is definitely in the fact table, as is Order Date, Ship Date, Quantity Sold and (most likely) Unit Price. Since all these things are linked to the order, and might change for each order.
Is the data in the column referring to data in another column and will always be the same? If yes, then this is probably a candidate for a dimensional table. In this example, the Customer Segment is probably something that is the same for a given customer on ALL the orders, so should be in a Customer Dimension. Likewise, the product category and sub-category are probably used to organise products, and therefore can be determined from the product name alone and don’t change from order to order.
Another way to help determine which columns go into the fact table is to think about the directness of the relationship between what is stored in the column and the grain of the fact table. For example in this case the Customer Name field is directly related to the order, but the Customer Segment field is related to the Customer Name field, which is then related to the order. Once removed or more usually means it should be in the dimensional table (again, providing the value is consistent for all orders, or should be).
Taking the time to think about the fact table grain, and determine which dimension tables you are going to build and what you are going to put in them is an important first step to creating a good data model for your data mart, and needs to be done no matter which tools you use to build it. If you want to try a visual, easy to use data transformation tool that lets you get at your data without having to resort to data base programming, check out the Datamartist tool.
« Data modelling Hierarchies- how to make a dimension | Datamartist at the Financial Technology Show in Toronto »


Just an observation: I think the answer for the “Is the data in the column something that is unique for every order?” question is incorrect and might confuse some people. You say that Quantity Sold and Unit Price would belong in there. But if there were multiple items on the order… there would be different quantities and unit price values per item.
Very nice explanation. I have a doubt. In Business Intelligence, in what way does identifying the granularity in a fact table helps?