« Creating a Fact Table with the Vendor dimension Purchasing DM (Part 2) | Hierarchies and Tree Structures in Dimensions- an Example Item Dimension (Part 4) »
Connecting the dimension table to the fact table- Vendor Example (Part 3)
 In parts one and two of this series we introduced our challenge (to make a data mart to analyze the Acme Company’s spending) and showed how the Datamartist tool could import millions of rows of data and then turn it into a fact table we can use in Excel.
Now we need to create a Vendor dimension table and join it to this fact table to determine who our big vendors are.
In Datamartist it is a simple task to create this vendor dimension. As always we use blocks and connect them together. We define a dimension by using a reference definition block. All we have to do to configure the reference block is to specify which columns uniquely define the dimension (or almost uniquely, Datamartist will resolve duplicate keys using a majority/first rule set for you if you have some data glitches).
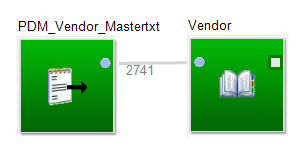
We start with an import block that brings in the Vendor master text file, then we define the reference by specifying “Vendor_ID” as the key. These first two blocks look like this:
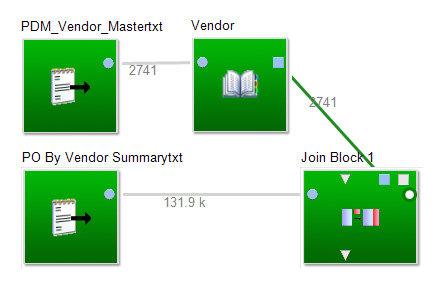
Then we join it to the fact table we created in part two of this series with a join block. This means that now instead of just the vendor ID number that was in the fact table, we have the name, and address for the vendor in our mini star schema.
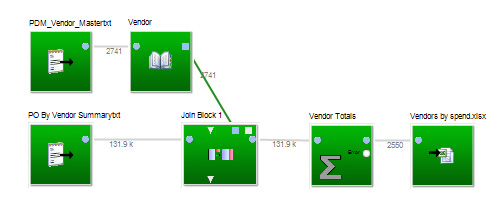
And finally we put a summarize block after that to total up all the monthly values for each vendor, and we export to excel. This is what the canvas looks like:
After we do this, we grab the excel file Datamartist just created for us, do a quick sort, and come up with a list of Acme’s top ten suppliers. Feeling pretty good about ourselves, we do a review with the head of purchasing.
“Where’s Mega brothers?” she says with a frown “I think your data is screwy- no way that Mega brothers didn’t make the top ten- we spend a fortune on railways, and a lot of our freight goes with the Mega Brothers Rail company. Of course it is probably entered under different vendors, each location works with the office local to them… But we’ve got to view them as a single vendor in the data mart- you can do that right?”
Fixing Duplicate Rows
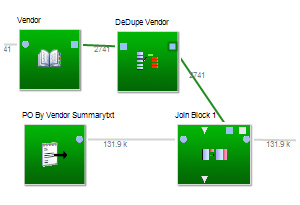
Having to deal with duplicate data is a very common issue in any type of data analysis. So, back to the canvas. By simply adding a de-duplicate block to our Vendor dimension table (after the Reference block, and before the join) we can find and resolve the Mega Brothers duplicates.
We just use the filter to find the records- (Easy to do, looking for “Mega” “rail” “brothers” etc. and we map them to a single instance.) This is the filter control that lets us find and tag the duplicates:
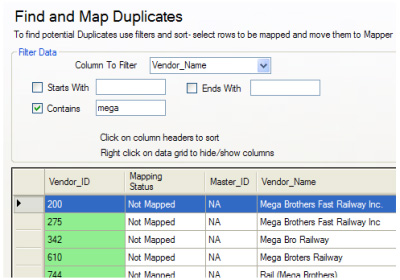
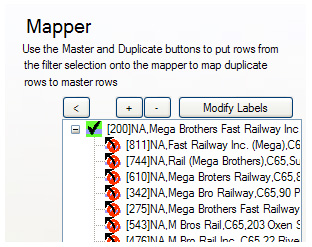 As we tag them, they show up in the mapper, which lets us see which duplicate records we have eliminated for the dimension. We run the canvas again, and this time, sure enough, Mega Brothers Rail is in our top ten. But even though the head of purchasing knew it was a lot, this is actually the first time she’s seen the number. “Wow. I’ve got to give them a call- can you give me that in an Excel spreadsheet?”
Stay tuned, more to come as we go further into Datamartist’s ability to segment, filter and organize large data sets.
If you want to see the interface in action watch our first Tutorial Video. Or just get right to it with your own data- download the free trial now– there is no registration required, and it installs in minutes.
This is part of a 5 part series- here are the links to the various parts: 1,2 , 3 , 4 and 5
« Creating a Fact Table with the Vendor dimension Purchasing DM (Part 2) | Hierarchies and Tree Structures in Dimensions- an Example Item Dimension (Part 4) »


About ten years ago, I wrote a really lame version of a data transformation process with visual symbols. The process drove the symbols (just so the user could at least understand what was happening) and there was hardly any flexibility. Even that took a lot of coding. So, to extrapolate this to the vast amount of work it must have taken to make this Datamartist tool, makes me very impressed.