
« Importing Data into Excel | Business Intelligence Workspaces and in memory self serve analysis »
Data mart Data Modelling 101
 Last time we talked about how much data can comfortably be put into and Excel spreadsheet and I’ve found that more than a few hundred thousand rows can get awkward. Plus, certain types of operations are more difficult to automate in excel (often requiring programming skills with macros or visual basic for applications (VBA)). So- this means we need an alternative to Excel, something to let us clean up and summarise or split our data so it can be exported into Excel to generate reports and analysis. For this example, I’ll use one of the better alternatives currently available- Microsoft Access. Very soon, I’ll show you with an upcoming alternative- nModal’s Datamartist.
What is our goal? To build a data mart. What is a data mart? A data mart is data that has been formatted for ease of analysis, and that contains the information that an analyst needs, even if that information was not in the original system or at least not in a format that is easy to use. The best way to model a data mart is to build it using two types of tables.
- Data- the FACTS – which define the who, what where, when of the data.
- Definitions – the DIMENSIONS – which describe the various things that are found in the Facts.
An example would be in order. Lets say we have some sales data that we are analysing. Ideally, we want to get this information in a format where the FACTS are that on date A, we sold product Y to customer Z with a quantity and a price. So in MS Access the columns might be:
Note that if we can we use Unique things to define the who what where when- for example, we don’t use the Customers name (how many John Smiths are there?) but we use a unique customer number or ID. Then we need three definition sets- Date, product and customer that match these IDs. By the way- creating these IDs when they don’t exist, and cleaning the duplicates up is one of the challenges- if you already have a clean set of customer numbers and data then you are way ahead.
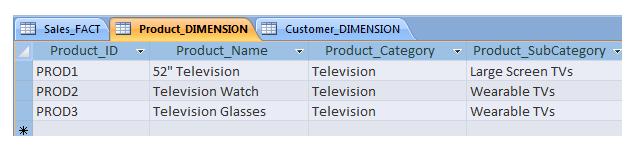
This is the key in terms of the data model- Sales_FACT holds JUST THE FACTS, and a table for each definition or DIMENSION, that holds just once the definition for each unique Product or customer. This way we have consistent information throughout the analysis- if something about a product changes we don’t have to change it in every row of the FACTS, we only have to change the single entry in, say, the product DIMENSION. The Product and Customer dimension tables might look like this (again in Access):


The final step in analysis is to combine the FACT and the DIMENSION to form a table or view that has all the information you need to slice and dice- often using a Pivot table in Excel is a good way to do this, or simply autofilters etc. But first in access it is necessary to create a query. This can be done by selecting “create” on the ribbon control, then design view, and showing the three tables we’ve created- the Sales_Fact, Product_DIMENSION and Customer_DIMENSION. Now its necessary to JOIN these tables together using the ID fields- this is done by dragging the Product_ID field from the Product_DIMENSION table and dropping it on the Product_ID field on the Sales_FACT table, and then dragging the Customer_ID field from the Customer_DIMENSION table and dropping it on the Customer_ID field on the Sales_FACT table.
This results in a query that returns all the rows in the table Sales_FACT with the product and customer information looked up from the two dimension tables and added in.
If anyone cares- the Structured Query Language (SQL) that is generated by Access was as follows:
SELECT Sales_FACT.[Sales Date], Sales_FACT.Quantity, Sales_FACT.Price, Product_DIMENSION.Product_Name, Product_DIMENSION.Product_Category, Customer_DIMENSION.Cust_Name, Customer_DIMENSION.Cust_Email, Sales_FACT.Product_ID, Sales_FACT.Customer_ID
FROM Customer_DIMENSION INNER JOIN (Product_DIMENSION INNER JOIN Sales_FACT ON Product_DIMENSION.Product_ID = Sales_FACT.Product_ID) ON Customer_DIMENSION.Customer_ID = Sales_FACT.Customer_ID;
This table structure is a very simple example of a STAR SCHEMA– the basic data model used by respectable data marts and data warehouses everywhere.
This is all good and well, if you happen to have the data in the right format- but usually the data is stored (or created) in the source system using very different data models than this simple star schema. This is done to allow the source system do transactions (both reading and writing data) quickly. The star schema is excellent for analysing data, but not effective for modifying it.
In the end this is the key as to why we need data transformation tools. Data in the source systems is often in the wrong format for analysis, or has quality issues that while perhaps not ideal, do not actually cause the transactional system to fail, so may not get addressed, but will radically affect your analysis. The transformation tool resolves these issues, and separates the data into the Fact, Dimension structure. This can be done with access, although if there are multiple transformations fairly complex queries or scripts must be created. Stay tuned to this channel- Datamartist will show you some tricks without having to figure through all the INNER JOIN SQL statements that tools like Microsoft Access needs to use…

« Importing Data into Excel | Business Intelligence Workspaces and in memory self serve analysis »
Thanks, this was very helpful for me.