
« Self Serve Business Intelligence | Microsoft Business Intelligence Full Court Press? »
MS Access query example and comparision to Datamartist
Microsoft Access allows users to create complex queries and analyze large data sets. However, it can be complicated to use compared to Excel. In this post, I’ll talk about ms access queries and the equivalent way to perform the same data transformation in the Datamartist tool– visually and simply.
Microsoft Access has a clear role to play when a small, light database application is required. However, it has a learning curve, and is not necessarily the best tool for data analysis.
Product Segmentation Query Example
Lets look at an example ms access query or two and see how we can do the same thing Datamartist, only without the queries and without any SQL. For this example, lets say that we have two sets of sales data from different time periods, and a product list, and we want to define some product segments based on color and price. We want to get a summary of the sales Qty and average price sold by month, broken out by the new categories which are as follows:
- “Red and High Priced” If the product is Red and its minimum price is more than $1000
- “Red Low Price wide price range” If the product is Red, has a minimum price less than $1000 but has a min to max price of more than $200
- “Red Low Price small price range” If its Red and not in the first two segments
- “Yellow” if the product is yellow.
- “Other” for all the rest
The three data tables we have are as follows:
- Sales 03-06 with about 120 000 rows, which contains sales data from 2003 – 2006
- Sales 2007 with about 30 000 rows, which contains sales data for 2007
- Products which contains the colors for all the products and their minimum and maximum prices
So- first step is to combine the two data tables, in Access, this is done with a UNION query with the following SQL code:
select * from [Sales Data 03-06] UNION select * from [Sales Data 2007];
In Datamartist, we simply connect the two tables up to a combine block.

Next, we need to define the segmentation- again in Access this is done with a Query, this time by nesting IIF statements to add a new column called “Product_Segment” to the resulting query.
SELECT Products.Product_ID, Products.Product_Name, Products.Product_Group, Products.Product_Category, Products.Product_SubCategory, Products.Shipping_Weight, Products.Color, Products.Price_Min, Products.Price_Max, IIf([Color]=”Red” And [Price_Min]>1000,”Red and High Priced”,IIf([Color]=”Red” And ([Price_max]-[Price_min])>200,”Red Low Price wide price range”,IIf([Color]=”Red”,”Red Low Price small price range”,IIf([Color]=”Yellow”,”Yellow”,”Other”)))) AS Product_Segment
FROM Products;
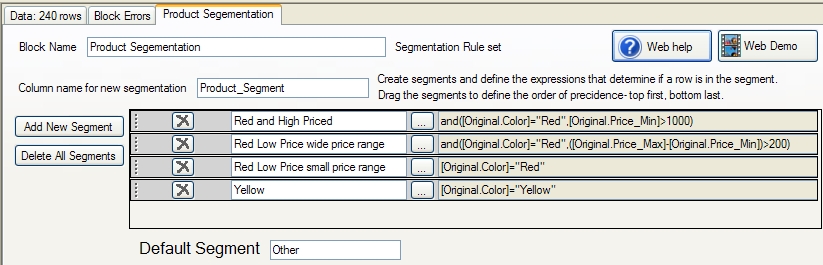
In Datamartist, we use a segmentation block to do the same thing. The interface is graphical, and the syntax is the same as you would use in Excel. There is no need to nest any IF statements, because the overall block is designed to do that. Heres what the blocks look like- the MS Access import block on the left, and the segmentation rule block on the right.

Each segment has the statement that defines if a row is in the segment or not. The block tests each segment rule in order, starting at the top- the first statement that solves as “TRUE” defines the value for the Product_Segment column for that row. Dragging the segments up and down changes what order the rules are checked.
(Click to Enlarge)
Then we have to Join this new product dimension (with the segmentation column) to the sales data, and summarize.
In MS Access, this is done with more queries- Heres what Access looks like when we’re done.

Compare that list of Tables and Queries to the visual, left to right layout of the Datamartist data canvas that does the same thing. Without ever having to write any SQL code:
The VISUAL way to do it


In Datamartist you can see the flow of the data, the row counts are clearly displayed, and clicking on the connectors will bring up the underlying data set in the data viewer. Its clear which block feeds which, and by adding more blocks and connecting them at the desired point in the data flow, new analysis can be created.
Take Datamartist for a trial run- download it now because maybe you don’t have to learn microsoft access queries after all.

« Self Serve Business Intelligence | Microsoft Business Intelligence Full Court Press? »
Alternatively, in MS Access albeit more complicated on the first run you could make the queries dynamic using a Form with VBA and obtain your information using a couple text boxes for select tables and fields. After the form is created you can then simply enter the table and field names followed by clicking a button.
The above does require knowledge of SQL queries and even more knowledge of VBA. But once you have the form it makes things very simple. Similar to what the above Datamartist example does. Can you save this process and execute it routinely with a single click or two like you can with a VBA form?
All Datamartist canvases are saved as DMC files, and can be run from within Datamartist with a single click.
We’ll be adding server side running of data canvases, and command line launch options in future versions.
Update: Command line and server scheduling will be in V1.2 expected out this Month (Feb 2010)